Back to Projects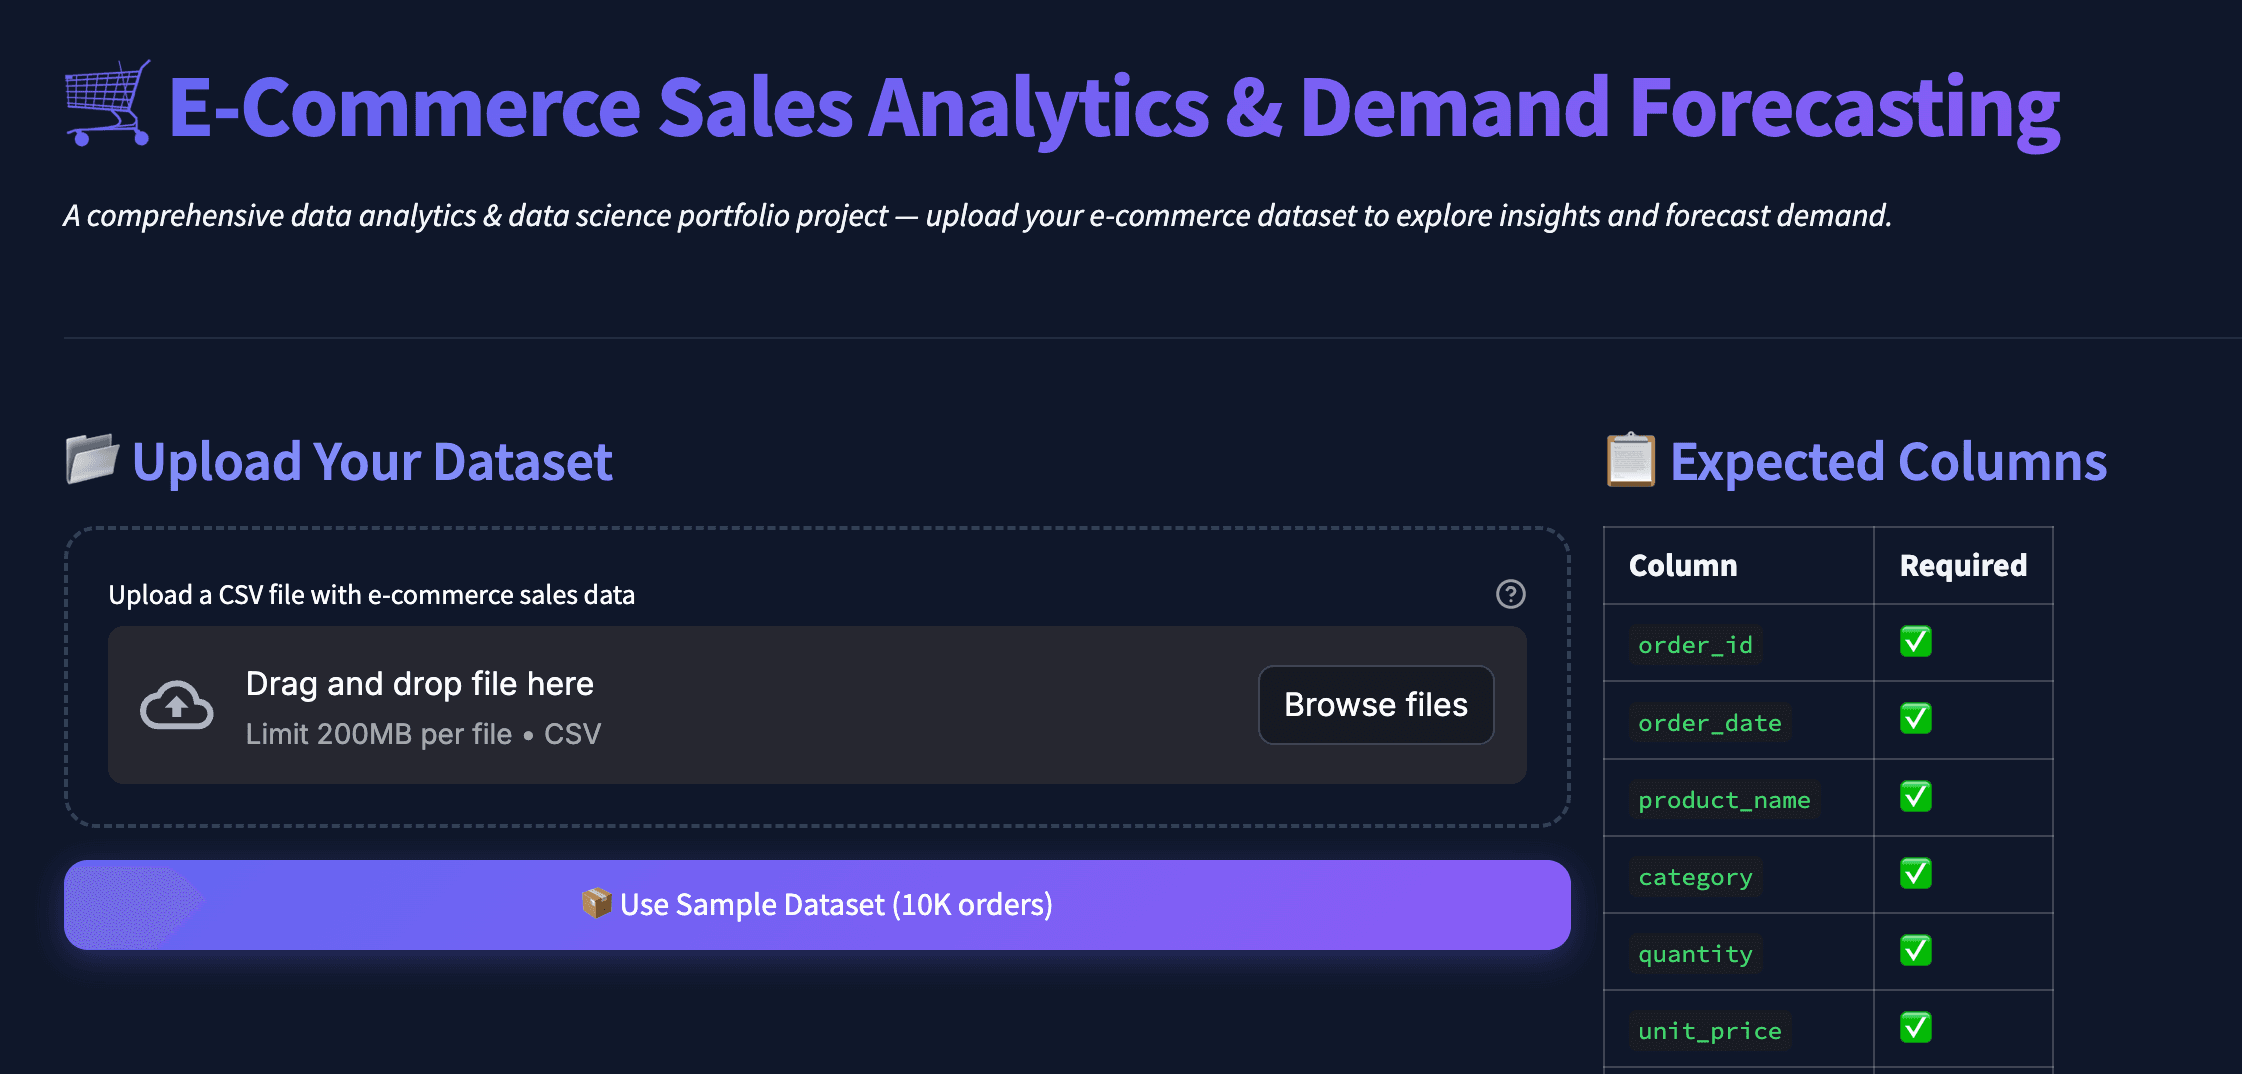
Commerce analytics interface
Analytics DashboardCompleted
Commerce Data Insights Dashboard
An interactive analytics application for exploring e-commerce performance and generating forecasting insights.
- Python
- Streamlit
- SQLite
- Pandas
- Plotly
- Scikit-learn
Interface Preview
Overview
An interactive analytics application for exploring e-commerce performance and generating forecasting insights.
Key Features
- CSV data processing
- SQLite storage
- KPI dashboard
- Product performance analysis
- Sales trends
- Interactive Plotly charts
- Demand forecasting
- Multiple machine-learning models
Technology / Architecture
- Python
- Streamlit
- SQLite
- Pandas
- Plotly
- Scikit-learn
Challenges & Learnings
Challenges
- Presenting commerce KPIs, trends, and forecasts without crowding the dashboard.
- Structuring imported CSV data so analytics views can stay responsive and understandable.
Learnings
- Dashboard value improves when exploratory views and forecast outputs are separated clearly.
- Local storage can keep analysis workflows simple for compact data applications.